Fix LeakyReLU image (#78508)
Fixes #56363, Fixes #78243
| [Before](https://pytorch.org/docs/stable/generated/torch.nn.LeakyReLU.html) | [After](https://docs-preview.pytorch.org/78508/generated/torch.nn.LeakyReLU.html) |
| --- | --- |
| 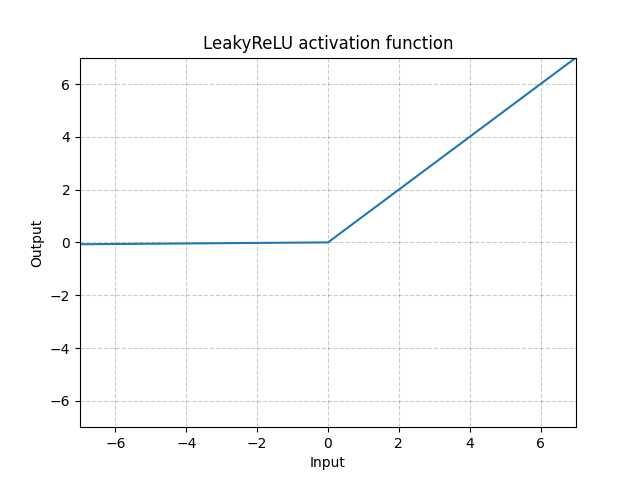 | 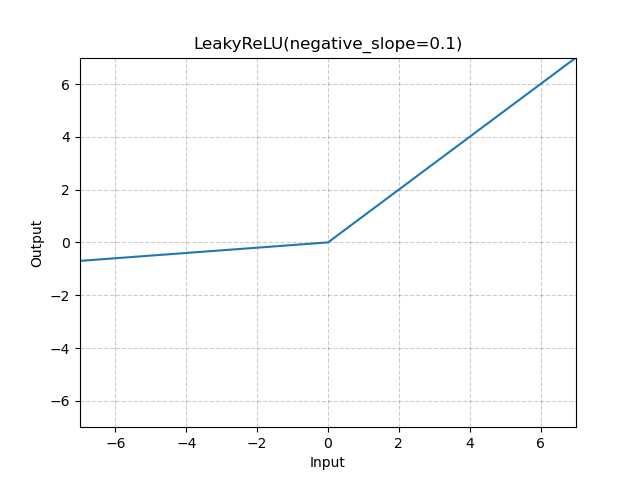 |
- Plot `LeakyReLU` with `negative_slope=0.1` instead of `negative_slope=0.01`
- Changed the title from `"{function_name} activation function"` to the name returned by `_get_name()` (with parameter info). The full list is attached at the end.
- Modernized the script and ran black on `docs/source/scripts/build_activation_images.py`. Apologies for the ugly diff.
```
ELU(alpha=1.0)
Hardshrink(0.5)
Hardtanh(min_val=-1.0, max_val=1.0)
Hardsigmoid()
Hardswish()
LeakyReLU(negative_slope=0.1)
LogSigmoid()
PReLU(num_parameters=1)
ReLU()
ReLU6()
RReLU(lower=0.125, upper=0.3333333333333333)
SELU()
SiLU()
Mish()
CELU(alpha=1.0)
GELU(approximate=none)
Sigmoid()
Softplus(beta=1, threshold=20)
Softshrink(0.5)
Softsign()
Tanh()
Tanhshrink()
```
cc @brianjo @mruberry @svekars @holly1238
Pull Request resolved: https://github.com/pytorch/pytorch/pull/78508
Approved by: https://github.com/jbschlosser
diff --git a/docs/source/scripts/build_activation_images.py b/docs/source/scripts/build_activation_images.py
index 3fb4412..94f0416 100644
--- a/docs/source/scripts/build_activation_images.py
+++ b/docs/source/scripts/build_activation_images.py
@@ -4,50 +4,46 @@
 online tutorials.
 """

-import os.path
-import torch.nn.modules.activation
-import torch.autograd
+from pathlib import Path
+
+import torch
 import matplotlib
+from matplotlib import pyplot as plt

-matplotlib.use('Agg')
-
-import pylab
+matplotlib.use("Agg")


 # Create a directory for the images, if it doesn't exist
-ACTIVATION_IMAGE_PATH = os.path.join(
-    os.path.realpath(os.path.join(__file__, "..")),
-    "activation_images"
-)
+ACTIVATION_IMAGE_PATH = Path(__file__).parent / "activation_images"

-if not os.path.exists(ACTIVATION_IMAGE_PATH):
-    os.mkdir(ACTIVATION_IMAGE_PATH)
+if not ACTIVATION_IMAGE_PATH.exists():
+    ACTIVATION_IMAGE_PATH.mkdir()

 # In a refactor, these ought to go into their own module or entry
 # points so we can generate this list programmaticly
 functions = [
-    'ELU',
-    'Hardshrink',
-    'Hardtanh',
-    'Hardsigmoid',
-    'Hardswish',
-    'LeakyReLU',  # Perhaps we should add text explaining slight slope?
-    'LogSigmoid',
-    'PReLU',
-    'ReLU',
-    'ReLU6',
-    'RReLU',
-    'SELU',
-    'SiLU',
-    'Mish',
-    'CELU',
-    'GELU',
-    'Sigmoid',
-    'Softplus',
-    'Softshrink',
-    'Softsign',
-    'Tanh',
-    'Tanhshrink'
+    torch.nn.ELU(),
+    torch.nn.Hardshrink(),
+    torch.nn.Hardtanh(),
+    torch.nn.Hardsigmoid(),
+    torch.nn.Hardswish(),
+    torch.nn.LeakyReLU(negative_slope=0.1),
+    torch.nn.LogSigmoid(),
+    torch.nn.PReLU(),
+    torch.nn.ReLU(),
+    torch.nn.ReLU6(),
+    torch.nn.RReLU(),
+    torch.nn.SELU(),
+    torch.nn.SiLU(),
+    torch.nn.Mish(),
+    torch.nn.CELU(),
+    torch.nn.GELU(),
+    torch.nn.Sigmoid(),
+    torch.nn.Softplus(),
+    torch.nn.Softshrink(),
+    torch.nn.Softsign(),
+    torch.nn.Tanh(),
+    torch.nn.Tanhshrink(),
 ]


@@ -57,33 +53,27 @@
     be used to specify color, alpha, etc.
     """
     xrange = torch.arange(-7.0, 7.0, 0.01)  # We need to go beyond 6 for ReLU6
-    pylab.plot(
-        xrange.numpy(),
-        function(xrange).detach().numpy(),
-        **args
-    )
+    plt.plot(xrange.numpy(), function(xrange).detach().numpy(), **args)


 # Step through all the functions
-for function_name in functions:
-    plot_path = os.path.join(ACTIVATION_IMAGE_PATH, function_name + ".png")
-    if not os.path.exists(plot_path):
-        function = torch.nn.modules.activation.__dict__[function_name]()
-
+for function in functions:
+    function_name = function._get_name()
+    plot_path = ACTIVATION_IMAGE_PATH / f"{function_name}.png"
+    if not plot_path.exists():
         # Start a new plot
-        pylab.clf()
-        pylab.grid(color='k', alpha=0.2, linestyle='--')
+        plt.clf()
+        plt.grid(color="k", alpha=0.2, linestyle="--")

         # Plot the current function
         plot_function(function)

-        # The titles are a little redundant, given context?
-        pylab.title(function_name + " activation function")
-        pylab.xlabel("Input")
-        pylab.ylabel("Output")
-        pylab.xlim([-7, 7])
-        pylab.ylim([-7, 7])
+        plt.title(function)
+        plt.xlabel("Input")
+        plt.ylabel("Output")
+        plt.xlim([-7, 7])
+        plt.ylim([-7, 7])

         # And save it
-        pylab.savefig(plot_path)
-        print('Saved activation image for {} at {}'.format(function, plot_path))
+        plt.savefig(plot_path)
+        print(f"Saved activation image for {function_name} at {plot_path}")