Trace Processor
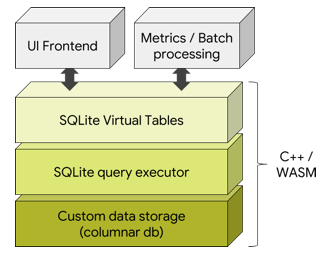
The Trace Processor is a C++ library (/src/trace_processor) that is able to ingest traces of various format and expose them in a massaged, higher level format, queryable through SQL queries. The trace processor is used:
- By the Perfetto UI, in the form of a Web Assembly module.
- Standalone, using the
trace_processor_shelltarget (ninja -C out/xxx trace_processor_shell). - In internal google3 pipelines for batch processing.
Supported input formats:
- Perfetto .proto traces
- [Partial support] Chrome .json trace events
- [NOT IMPLEMENTED YET] ftrace format as per
/sys/kernel/debug/tracing/trace.
Rationale
Traces are raw because they are optimized for fast & low overhead writing. Despite being protos, their output is not ideal for being consumed by third parties as-is. Some data massaging is required.
Examples:
- Ftrace sched_switch events only provide thread names and thread IDs. In order to attribute execution times to the package/process that data needs to be joined with the process_tree events to join TIDs with their parent PID and process name.
- Even after this join, sched_switch events produce two slices (one at the beginning, one at the end) per sched event. What most consumers want to see instead is one “interval” per thread execution time-slice.
- Similarly ftrace ext4 events provide only inode numbers and those need to be joined with inode->path events.
Schema
sched table
The sched table holds data about scheduling slices in the trace.
ts
Timestamp of the scheduling event, in nanoseconds. This comes from the CLOCK_BOOTTIME, when available.
dur
Duration of the scheduling event, in nanoseconds.
utid
ID of the thread. This is NOT the UNIX pid/tid (see below). This can be joined with the thread table.
cpu
CPU number where the scheduling event happened.
counters table
The counters table contains the data about counter events (both kernel and userspace) in the trace. This includes sources like memory, battery, cpufreq events etc.
id
A unique identifier for the counter row.
ts
The timestamp of the counter event.
name
The name of the counter event.
value
The value of the counter event.
ref
The identifier of the reference metadata associated with the counter event. See ref_type for what data this can contain.
ref_type
The type of reference metadata associated to the counter event. Will be one of the following values utid (the ref is an identifier for the thread table), upid (same for process table), cpu (the cpu the event occurred on), irq and softirq.
arg_set_id
The identifier into the args table. (see below)
instants table
The instants table contains the data about instant events (both kernel and userspace) in the trace. This includes sources like the lmk, sched_wakeup events etc.
id
A unique identifier for the instant row.
ts
The timestamp of the instant event.
name
The name of the instant event.
‘value’
The value of the instant event.
ref
The identifier of the reference metadata associated with the instant event. See ref_type for what data this can contain.
ref_type
The type of reference metadata associated to the instant event. Will be one of the following values utid (the ref is an identifier for the thread table), upid (same for process table), cpu (the cpu the event occurred on), irq and softirq.
arg_set_id
The identifier into the args table. (see below)
slices table
The slices table holds data about the userspace slices (from Chrome or Android) seen in the trace. These slices can be nested within each other forming ‘stacks’ of slices.
ts
The timestamp of the userspace slice in nanoseconds.
dur
Duration of the userspace slice, in nanoseconds.
utid
ID of the thread. This is NOT the UNIX pid/tid (see below). This can be joined with the thread table.
cat
The category of the slice. Only non-null and meaningful for Chrome traces.
name
The name of the slice.
depth
The nesting depth of the slice within the stack. Starts at 0 for root slices and counts upward for child slices.
stack_id
A unique identifier for the whole stack of slices to the current point. This identifier is useful when deriving metrics on unique stacks of slices.
parent_stack_id
The ‘stack_id’ for the parent stack of slices. This is 0 for all root slices and a reference to a ‘stack_id’ otherwise.
process table
The process table holds data about the processes seen in the trace.
upid
Unique process ID. This is NOT the UNIX pid. This is a sequence number generated by the trace processor to uniquely identify a process in the trace. This is to deal with the fact that UNIX pids can be recycled and two distinct processes which lifetimes don't overlap can be assigned the same pid.
name
Process name, as per /proc/pid/cmdline.
pid
The UNIX pid (also known as Thread Group ID in Linux). This also matches the tid of the process' main thread.
Example:
| upid | name | pid |
|---|---|---|
| 1 | /system/bin/logd | 601 |
| 2 | rcu_preempt | 7 |
| 3 | rcuop/4 | 44 |
| 4 | rcuop/6 | 60 |
thread table
The thread table holds data about the threads seen in the trace.
utid
Unique thread ID. This is NOT the Linux pid or tid. Like the above, this is a sequence number generated by the trace processor to uniquely identify a thread in the trace.
upid
ID of the parent process in the process table. This can be used to JOIN a thread with its process.
name
Thread name, as per /proc/pid/task/tid/comm.
tid
The Linux thread id (confusingly named “pid” in the Linux-world). For the process' main thread tid == tgid == pid.
Example:
| utid | upid | name | tid |
|---|---|---|---|
| 1 | 1 | logd.klogd | 632 |
| 2 | 2 | rcu_preempt | 7 |
| 3 | 4 | rcuop/6 | 60 |
| 4 | 6 | rcuop/3 | 36 |
| 5 | 8 | sugov:0 | 588 |
| 6 | 9 | kworker/u16:6 | 9283 |
| 7 | 12 | sensors@1.0-ser | 1021 |
| 8 | 12 | HwBinder:797_1 | 1626 |
stats table
The stats table holds the statistics from the trace collection tool as well as counters from the trace processor collected during parsing and ingesting the trace
name
The name of the stat.
idx
The index of the stat in the array. This value is only non-null for stats which are indexed (e.g. ftrace overrun events are indexed per CPU).
severity
The severity of the value indicated by the stat. Can be one of ‘info’ and ‘error’.
source
The source of the stat i.e. whether is is coming from the trace collection time or parsing/ingestion time. One of ‘trace’ (i.e. trace collection time) or ‘analysis’ (parsing/ingestion time).
value
The value of the statistic.
args table
The args table is a generic store of key value pairs deduplicated across the entire trace. A ‘set’ of arguments is given a unique identifier and can be referenced from other tables.
arg_set_id
The identifier for the set of arguments this arg belongs to.
flat_key
The key of the arg excluding any indexing for args which are arrays.
key
The long form key of the arg (including any indexes for array args.)
int_value, real_value, string_value
The value of the arg. One of these columns will be non-null depending on the type of the arg with the other two being null.
Sample queries for the sched (sched_switch events) table
Trace duration
select ((select max(ts) from sched) - (select min(ts) from sched)) / 1e9 as duration_sec
Total CPU usage
select cpu, sum(dur)/1e9 as cpu_time_sec from sched group by cpu order by cpu
List all processes
select process.name, pid from process limit 100
List all processes and threads
select process.name as proc_name, pid, thread.name as thread_name, tid from thread left join process using(upid) limit 100
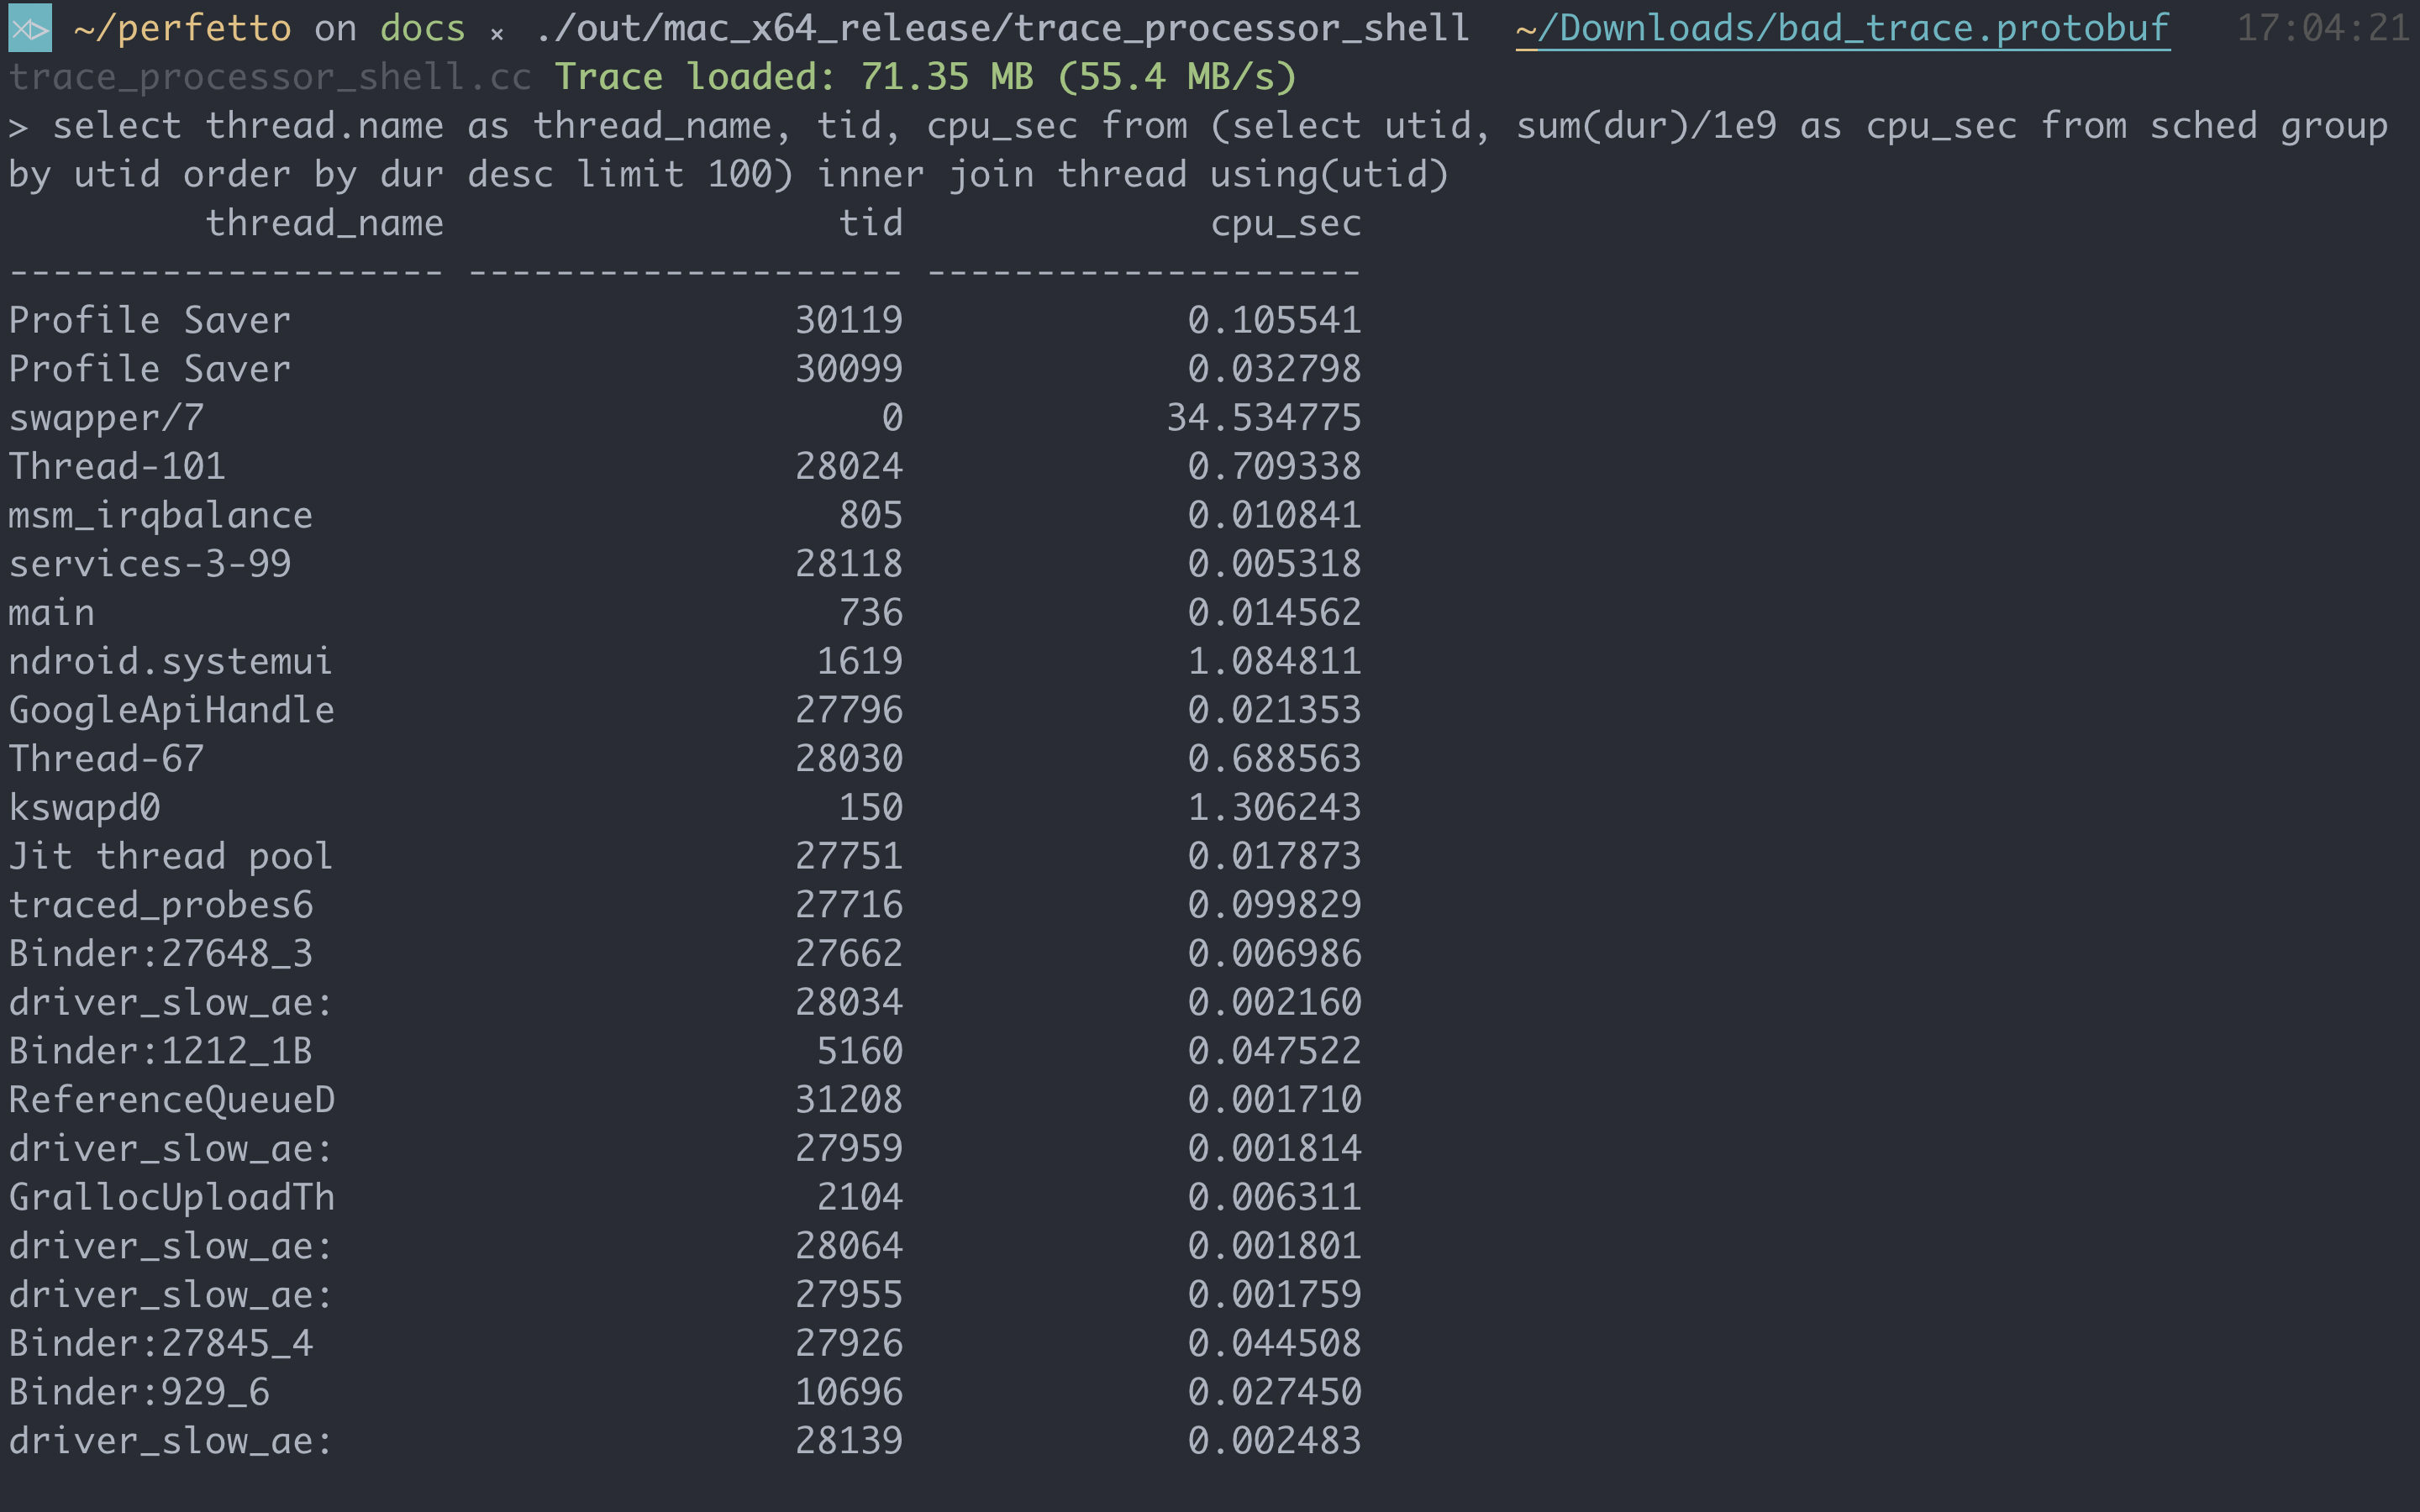
CPU time for top 100 threads
select thread.name as thread_name, tid, cpu_sec from (select utid, sum(dur)/1e9 as cpu_sec from sched group by utid order by dur desc limit 100) inner join thread using(utid)
With matching process names
select thread.name as thread_name, process.name as proc_name, tid, pid, cpu_sec from (select utid, sum(dur)/1e9 as cpu_sec from sched group by utid order by dur desc limit 100) left outer join thread using(utid) left outer join process using(upid)
CPU time for top 100 processes
select process.name, tot_proc/1e9 as cpu_sec from (select upid, sum(tot_thd) as
tot_proc from (select utid, sum(dur) as tot_thd from sched group by utid) join
thread using(utid) group by upid) join process using(upid) order by cpu_sec desc
limit 100;
CPU time for top 100 processes broken down by cpu
select proc_name, cpu, cpu_sec from (select process.name as proc_name, upid, cpu, cpu_sec from (select cpu, utid, sum(dur)/1e9 as cpu_sec from sched group by utid) left join thread using(utid) left join process using(upid)) group by upid, cpu order by cpu_sec desc limit 100