

Huge Project Refresh

Before anyone freaks out, all these changes are under-the-hood, meaning that you probably won't even notice them at all.

The biggest difference is raising the minSdkVersion from 9 to 14. Recently android bumped this number interally as there are basically no devices running lower than 14 anymore. Sorry but you are just wasting your time if you are trying to support anything lower than 14 now.

The next biggest change is updating the project to the new AndroidX libraries, which changes some imports and nothing else really.

The third biggest change is fixing a few bugs in the code that cause values to be drawn even if there are none, which results in your app crashing. Surprisingly, these checks already existed in a few of the newer chart types, but most lacked this simple check.

Other than those three changes, nothing else is functionally different. Well, saving to gallery works on all charts in the example app now, and you can quickly see the code for each example in the menus.

The only real potential "breaking" change is that charts are now saved as PNGs by default instead of JPGs if you go the route of not specifying as a JPG. You may want to double check your file sizes as PNGs can be larger than low quality JPGs.

I still have more plans for simplifying the API and fixing other issues with the project, for the small few that closely pay attention to individual commits: there's going to be more soon.





:zap: A powerful & easy to use chart library for Android :zap:
Charts is the iOS version of this library
MPAndroidChart is free software, as a result dynamic & realtime data is not officially supported. If you are looking for an enterprise-grade chart solution with extreme realtime performance and tech support, we recommend SciChart Android.
All MPAndroidChart users are entitled to a special discount of 5% off the SciChart store, using the following discount code: MPANDROIDCHART
Sign up for my daily coding newsletter to get quick updates on Kotlin and Android development related topics.
Gradle
build.gradleallprojects { repositories { maven { url 'https://jitpack.io' } } }
build.gradledependencies { implementation 'com.github.PhilJay:MPAndroidChart:v3.0.3' }
Maven
<!-- <repositories> section of pom.xml -->
<repository>
    <id>jitpack.io</id>
   <url>https://jitpack.io</url>
</repository>


<!-- <dependencies> section of pom.xml -->
<dependency>
    <groupId>com.github.PhilJay</groupId>
    <artifactId>MPAndroidChart</artifactId>
    <version>v3.0.3</version>
</dependency>
See the documentation for examples and general use of MPAndroidChart.
See the javadocs for more advanced documentation.
Download the MPAndroidChart Example App or look at the source code.

This repository's issue tracker is only for bugs and feature requests. The maintainers ask that you refrain from asking questions about how to use MPAndroidChart through the issue tracker.
Please read the documentation first, then ask all your questions on stackoverflow.com for the fastest answer.
This project needs you! If you would like to support this project's further development, the creator of this project or the continuous maintenance of this project, feel free to donate. Your donation is highly appreciated (and I love food, coffee and beer). Thank you!
My Bitcoin Wallet (Bitcoin only)
1G8G6tqQ3oh38BvDH3xq8o6gGVMvBTkcUg
My Ethereum Wallet (Ethereum only)
0x04ef098bf9f91871391363e3caf791afa3adc39b
PayPal
If you like this library, please tell others about it :two_hearts: :two_hearts:


You can follow me on Twitter @PhilippJahoda or sign up for my daily coding newsletter.
LineChart (with legend, simple design)

LineChart (with legend, simple design)
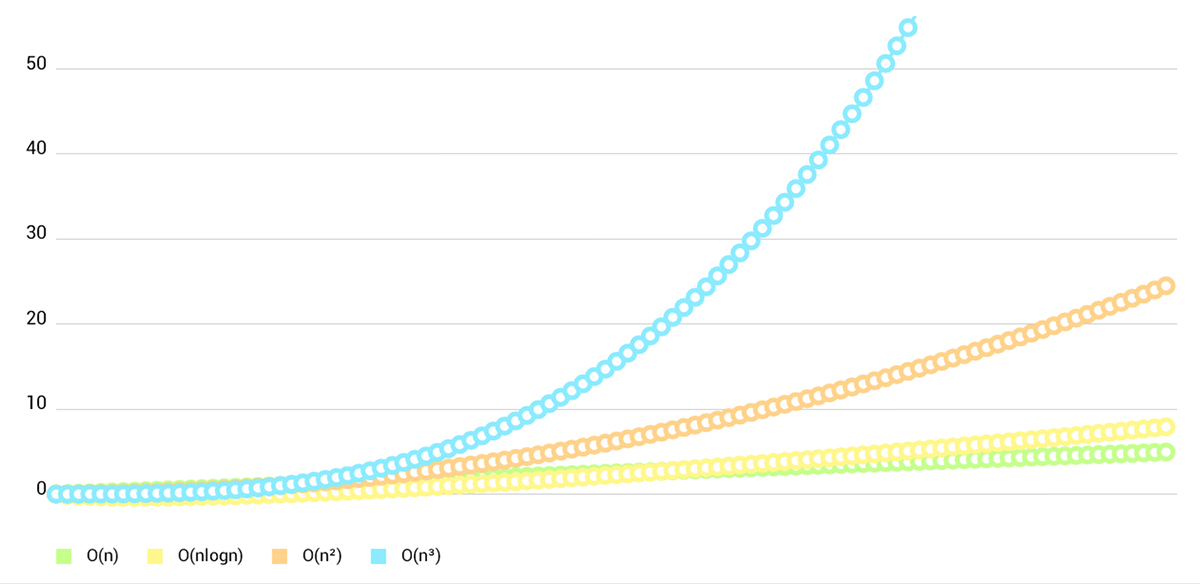
LineChart (cubic lines)
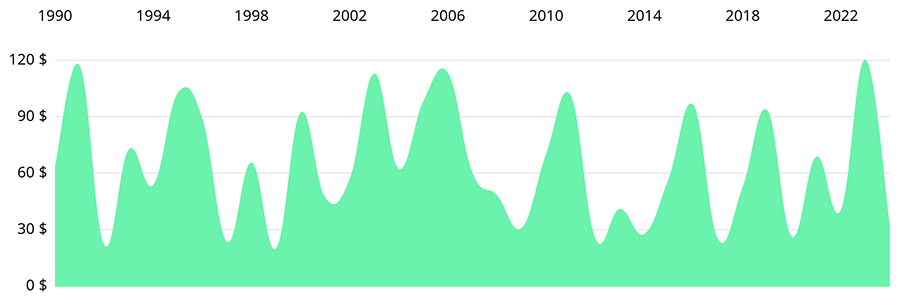
LineChart (gradient fill)
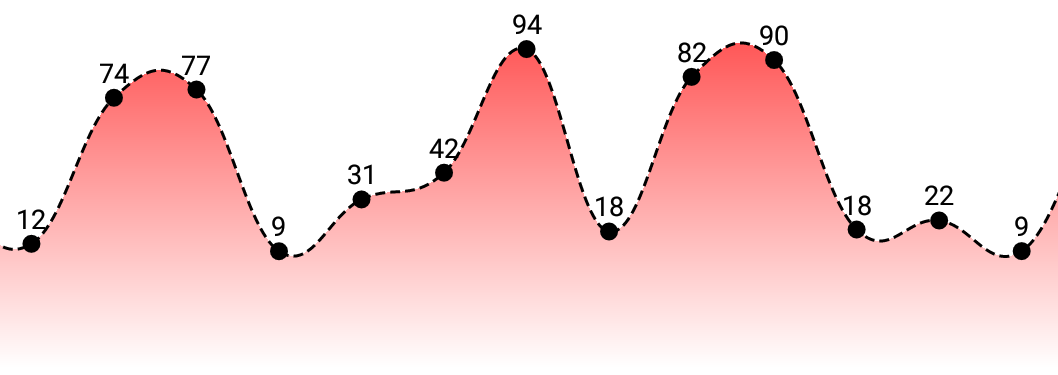
BarChart (with legend, simple design)

BarChart (grouped DataSets)

Horizontal-BarChart
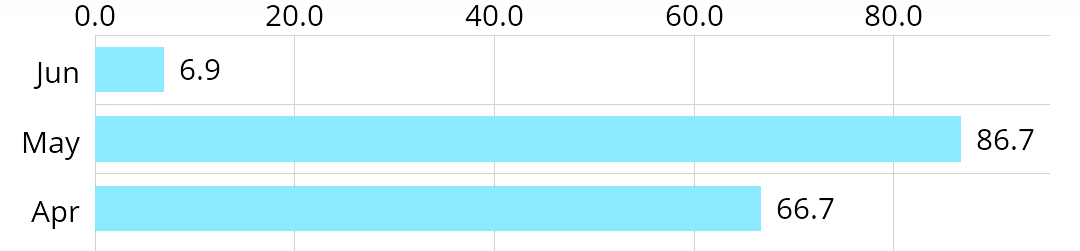
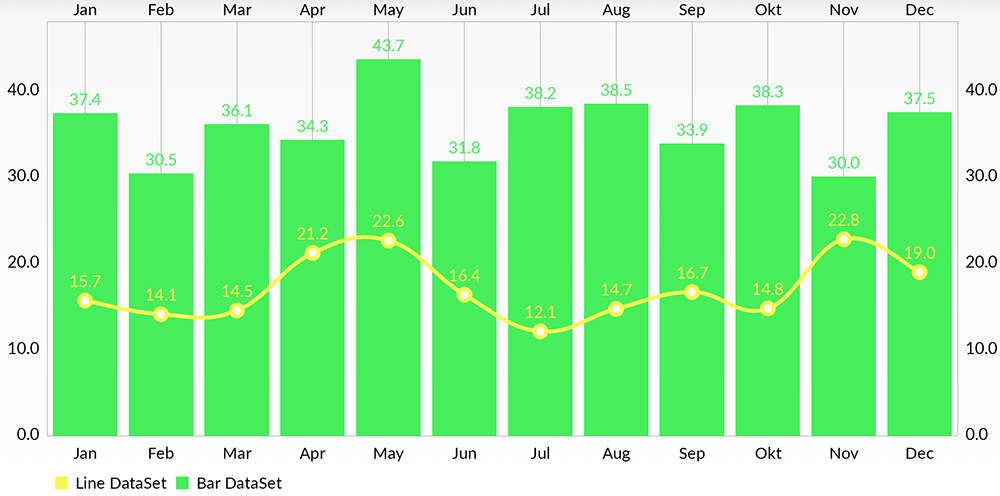
Combined-Chart (bar- and linechart in this case)
PieChart (with selection, ...)

ScatterChart (with squares, triangles, circles, ... and more)

CandleStickChart (for financial data)

BubbleChart (area covered by bubbles indicates the yValue)

RadarChart (spider web chart)

Copyright 2018 Philipp Jahoda
Licensed under the Apache License, Version 2.0 (the “License”); you may not use this file except in compliance with the License. You may obtain a copy of the License at
http://www.apache.org/licenses/LICENSE-2.0
Unless required by applicable law or agreed to in writing, software distributed under the License is distributed on an “AS IS” BASIS, WITHOUT WARRANTIES OR CONDITIONS OF ANY KIND, either express or implied. See the License for the specific language governing permissions and limitations under the License.
These people rock!
