| commit | 95f285b551b98281cdd87faadb956f978105cb3f | [log] [tgz] |
|---|---|---|
| author | Cristian Cardoso <cristian.car@samsung.com> | Mon Jul 28 16:11:34 2014 -0400 |
| committer | Cristian Cardoso <cristian.car@samsung.com> | Mon Jul 28 16:11:34 2014 -0400 |
| tree | 8c5267a29054311e2f38edcc94ff097df54658cf | |
| parent | 51f295dd34c0228b550f36392335d537e7880a8f [diff] |
All values "Entry.getVal ()" equal
A simple charting library for Android, supporting line- bar- and piecharts, scaling, dragging and selecting.
Remember: It's all about the looks.
For immediate access to our latest updates, please checkout the experimental branch. Beware that code on the experimental branch is not finished for release yet and might be incomplete or contain bugs.
If you are having questions or problems, feel free to contact me, create issues for this project on GitHub or open questions on stackoverflow with the mpandroidchart tag.
Forks, pull-requests or any other forms of contribution are always welcome.
For a brief overview of all features, please download the MPAndroidChart Example .apk from the PlayStore.
Core features:
Chart types:
LineChart (single DataSet) 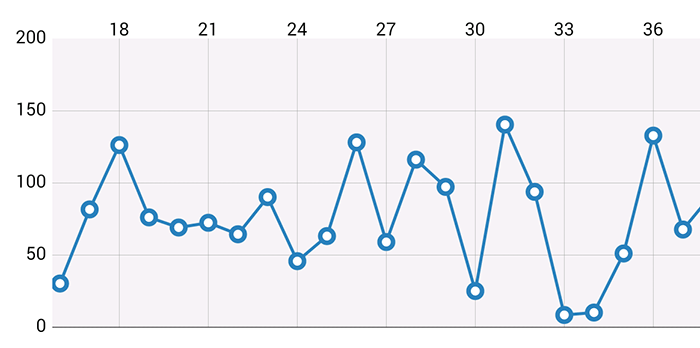
LineChart (multiple DataSets) 
LineChart (with legend, simple design) 
LineChart (with legend, simple design) 
BarChart2D (with legend, simple design)


Rely on the “MPChartExample” folder and check out the examples in that project. The example project is also available in the Google PlayStore.
Furthermore, here is some code to get started.
Setup:
For using a LineChart, BarChart or PieChart , define it in .xml:
    <com.github.mikephil.charting.charts.LineChart
        android:id="@+id/chart"
        android:layout_width="match_parent"
        android:layout_height="match_parent" />
LineChart chart = (LineChart) findViewById(R.id.chart);
or create it in code (and then add it to a layout):
LineChart chart = new LineChart(Context);
Styling:
Getters and convenience:
Gestures & Selecting:
Other:
setScaleMinima(...) method.Adding data:
If you want to add values (data) to the chart, it has to be done via the
setData(ChartData data);
method. The ChartData class encapsulates all data and information that is needed for the chart during rendering. In the constructor, you can hand over an ArrayList of type DataSet as the values to display, and an additional ArrayList of String that will describe the legend on the x-axis.
public ChartData(ArrayList<String> xVals, ArrayList<DataSet> dataSets) { ... }
So, what is a DataSet and why do you need it? That is actually pretty simple. One DataSet object represents a group of entries (datatype Entry) inside the chart that belong together. It is designed to logically separate different groups of values in the chart. As an example, you might want to display the quarterly revenue of two different companies over one year. In that case, it would be recommended to create two different DataSet objects, each containing four values (one for each quarter). As an ArrayList to describe the legend on the x-axis, you would simply provide the four Strings “1.Q”, “2.Q”, “3.Q”, “4.Q”.
Of course, it is also possible to provide just one DataSet object containing all 8 values for the two companys.
So how to setup a DataSet object?
public DataSet(ArrayList<Entry> yVals, String label) { ... }
When looking at the constructor, it is visible that the DataSet needs an ArrayList of type Entry and a String used to describe the DataSet and as a label for the Legend. Furthermore this label can be used to find the DataSet amongst other DataSet objects in the Chartdata object.
The ArrayList of type Entry encapsulates all values of the chart. A Entry object is an additional wrapper around a value and holds the value itself, and it's position on the x-axis (the index inside the ArrayList of String of the CharData object the value is mapped to):
public Entry(float val, int xIndex) { ... }
Putting it all together (example of two companies with quarterly revenue over one year):
At first, create the lists of type Entry that will hold your values:
    ArrayList<Entry> valsComp1 = new ArrayList<Entry>();
    ArrayList<Entry> valsComp2 = new ArrayList<Entry>();
Then, fill the lists with Entry objects. Make sure the entry objects contain the correct indices to the x-axis. (of course, a loop can be used here, in that case, the counter variable of the loop could be the index on the x-axis).
    Entry c1e1 = new Entry(100.000f, 0); // 0 == quarter 1
    valsComp1.add(c1e1);
    Entry c1e2 = new Entry(50.000f, 1; // 1 == quarter 2 ...
    valsComp1.add(c1e2);
    // and so on ...

    Entry c2e1 = new Entry(120.000f, 0); // 0 == quarter 1
    valsComp2.add(c2e1);
    Entry c2e2 = new Entry(110.000f, 1; // 1 == quarter 2 ...
    valsComp2.add(c2e2);
    //...
Now that we have our lists of Entry objects, the DataSet objects can be created:
    DataSet setComp1 = new DataSet(valsComp1, "company 1");
    DataSet setComp2 = new DataSet(valsComp2, "company 2");
Last but not least, we create a list of DataSets and a list of x legend entries and build our ChartData object:
    ArrayList<DataSet> dataSets = new ArrayList<DataSet>();
    dataSets.add(setComp1);
    dataSets.add(setComp2);

    ArrayList<String> xVals = new ArrayList<String>();
    xVals.add("1.Q"); xVals.add("2.Q"); xVals.add("3.Q"); xVals.add("4.Q");

    ChartData data = new ChartData(xVals, dataSets);
    chart.setData(data);
Now, our ChartData object can be set to the chart. But before drawing it, colors need to be specified. If no colors are specified when the data is drawn, the default ColorTemplate will be used.
Setting colors:
Setting colors can be done via the ColorTemplate class that already comes with some predefined colors (constants of the template e.g. ColorTemplate.LIBERTY_COLORS).
Explaination: The ColorTemplate basically has two methods for setting colors:
addDataSetColors(int[] colors, Context c): This method will add a new array of colors for the DataSet at the current index. The current index starts at 0 and depends counts up per call of this method. If no calls of this method have been done before, the colors set in this call will be used for the DataSet at index 0 in the ChartData object. Upon calling this method again on the same ColorTemplate object, the provided color values will be used for the DataSet at index 1.
addColorsForDataSets(int[] colors, Context c): This method will spread the provided color values over an equal amount of DataSet objects, using only one color per DataSet.
In our example case, we want one color for each DataSet (red and green), which will mean, that all entries belonging to the same DataSet will have the same color:
    ColorTemplate ct = new ColorTemplate();
    ct.addColorsForDataSets(new int[] { R.color.red, R.color.green }, this);
    chart.setColorTemplate(ct);
It would also be possible to let each DataSet have variations of a specific color. For example company 1 should have 4 colors from light to dark red, and company 2 should have 4 colors from light to dark green. In that case, we specify a color array for each DataSet:
    ColorTemplate ct = new ColorTemplate();
    ct.addDataSetColors(redColors, this); // redColors is an array containing 4 colors
    ct.addDataSetColors(greenColors, this);
    chart.setColorTemplate(ct);
Displaying legends:
By default, all subclasses of BarLineChartBase support legends and will automatically generate and draw a legend after setting data for the chart.
The number of entries the automatically generated legend contains depends on the number of used colors as well as on the number of DataSets used in the chart. The labels of the Legend depend on the labels set for the used DataSet objects in the chart. If no labels for the DataSet objects have been specified, the chart will automatically generate them.
For customizeing the Legend, use you can retreive the Legend object from the chart after setting data.
    // setting data...
    chart.setData(....);

    Legend l = chart.getLegend();
    l.setFormSize(10f);
    l.setForm(LegendForm.CIRCLE);
    l.setPosition(LegendPosition.LEFT_OF_CHART);
    l.setTypeface(...);
    // and many more...
More documentation and example code coming soon.
Copyright 2014 Philipp Jahoda
Licensed under the Apache License, Version 2.0 (the “License”); you may not use this file except in compliance with the License. You may obtain a copy of the License at
http://www.apache.org/licenses/LICENSE-2.0
Unless required by applicable law or agreed to in writing, software distributed under the License is distributed on an “AS IS” BASIS, WITHOUT WARRANTIES OR CONDITIONS OF ANY KIND, either express or implied. See the License for the specific language governing permissions and limitations under the License.
Special thanks to mikegr and ph1lb4 for their contributions to this project.